
Finance sentiment analysis
Finance sentiment analysis: Analysising yahoo finance stock articles on meta to steer investment direction
#pytorch|| #hugginface model || #transformers || #feedparser
View Dashboard
I am a Data Analyst / scientist with a keen interest in exploring complex datasets, finding patterns, and turning insights into actionable solutions that drive business growth. I am proficient in data analysis, data manipulation, data visualization, and data modelling techniques. I'm comfortable working with tools such as PowerBI, SQL, Excel, Python, Tableau, pytourch, tensorflow. I am constantly seeking to expand my skill set and stay up-to-date with the latest trends and technologies in the field.
Having worked in finance and consulting. I believe that the key to successful in an organization is critically looking at data because they don't lie. I'm always striving to improve my ability to communicate complex data concepts to non-technical stakeholders in a clear and concise manner. In my free time, I enjoy exploring new data sets, experimenting with data visualization tools, writing and following up on marketing trends.
My Resume
I write about data analytics, data scientist and low code automation tips.
Checkout my BlogData Analyst Portfolio Projects.
Finance sentiment analysis: Analysising yahoo finance stock articles on meta to steer investment direction
#pytorch|| #hugginface model || #transformers || #feedparser
View Dashboard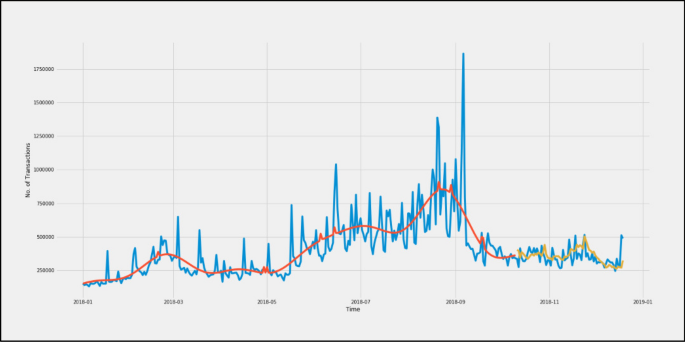
Segmenting customer: For exponential growth and retention of customer
#sql || #nth function || #segmentation || #CTE
View Dashboard
Transformation layer: Creating a CI/CD infraustructural approach to data pipline
#sql || #dbt core || #CI/CD || #Analytical engineering #Big query
View Dashboard
Data Wrangling (Data Gathering, Data Assessing, Data Cleaning, Data Analysis and Visualization)
#Python || #Pandas || #matplotlib || #Power bi
View Project
Sql queries (Database, Microsoft sql server, Data Cleaning, Joining tables)
#sql || #github || #database || #queiries
View Project
Google data analytics captone project
#R || #github || #Visualization || #Insights
View Project
AT $ T Internat Data sales Visualisation: Empowering Business with Effective Insights
#Excel || #Sql || #PowerBI
View dashboard
Google Capstone Project: Bike usage and environmental health implication
#Excel || #Pivot table || #Dashboard
View Project
Business Analyisis: Using power bi for RWA reporting with european bank data
#Power BI || #Excel || #PowerQuery
View Dashboard
Sensor data analytics using python: Visualization of batched data for a greenhouse
#Python || #matplotlib || #seaborn || #numpy
View Dashboard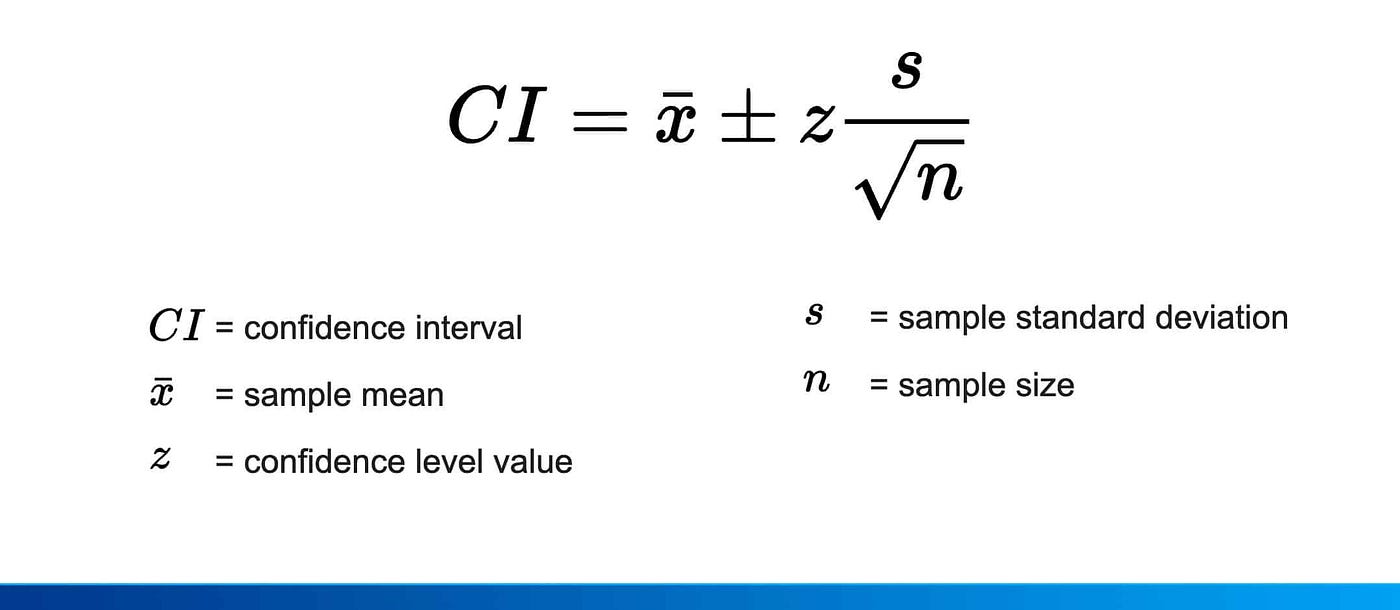
Regression & Confidence level analysis: Using Regression and confidence interval to determine tolerable failed transaction percent for maximiing TPV
#scipy.stats || #pandas || #PolynomialFeatures
View Dashboard